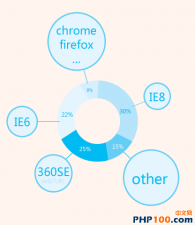
图形和图表主要用于以如饼图、折线图、条形图等方式展示数值数据的直观形式。有众多的技术利用CSS3来创建不同的图表。在任何Web行业,一个良好和优秀的数据演示可以让客户直观了解你分析的内容。
本文介绍 20 个使用 CSS 技术构建的基于 Web 的图形和图表技术:
CSS3 Charts
Pure Css Data Chart
Wicked CSS3 3d bar chart
Data Visualization: Flexible Bar Graphs using CSS
CSS Stacked Bar Graphs
Creating Pie Charts with CSS3
The CSS and PHP Bar Graph
PlotKit
Accessible Data Visualization with Web Standards
CSS Vertical Bar Graphs
Creating a graph
List bar chart
An accessible bar chart
CSS3 Graph Animation
CSS3 Bar Graphs
CSS3 Chart
CSS3 bar charts
Animated wicked CSS3 3d bar chart
A Snazzy Animated Pie Chart
How to Create Pie Charts with CSS3
Source:


